Contents
- Intro
- Pre-install
- DB config
- Installation
- Options reference
- Dispatchers
- Example operation
- Extending redax
- Waveform simulator
Redax installation and initial configuration
This section explains how to install and configure redax with a simple example deployment strategy involving two readout PCs reading out digitizers and one PC additionally controlling a V2718 crate controller.
Figure I-1 illustrates this example setup.
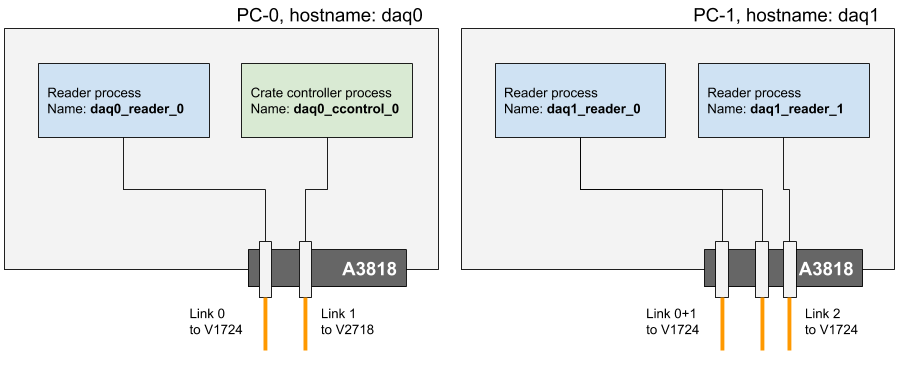
Figure I-1: We will refer to this example setup for this chapter. This is only for illustration.
PC-0 is the more straightforward case. It runs one readout process which is responsible for reading out the digitizers connected to A3818 optical link 0. It additionally runs one crate controller process that controls a V2718 crate controller connected to A3818 optical link 1.
PC-1, on the other hand, showcases the ability of redax to read out multiple optical links. From the perspective of raw readout speed there is no disadvantage to this since each optical link is read internally in its own thread. On the other hand, a second process is employed on the same PC reading out the third link. This is also allowed since the command addressing and dispatcher logic refers to the ‘daq name’ of the process, not just the hostname of the PC. One downside of this configuration is that both processes log to the database, and for XENONnT the status documents from the processes is about 1 GB/day.
Reader installation: Run on both PCs
If you already have the prerequities described in a previous chapter this is as simple as compiling the software and running it.
$ cd redax
$ make -j
You then need to start the process, which takes three important command line arguments and a few other optional ones.
$ ./redax --id <ID> --uri <MONGO_URI> [--db <DATABASE>] [--logidr <path/to/directory>] [--reader | --cc] [--log-retention <days>] [--arm-delay <ms>] [--help]
|Argument|Description|Required|
| —– | —– | —– |
|–id | The identifier for this instance of redax on this host. Must not be the same as any other instance on this host, but can be the same as one on another host. Numbers are simplest, but in principle you could name them after people you (don’t) like.| Yes |
| –uri | The full URI of the database you’re connection to, in the form mongodb://{username}:{password}@{host}:{port}/{authentication}. | Yes |
| –reader, –cc | Which specific task you want this instance to do. --reader means you want to read from digitizers, --cc means you want to be the crate controller. You must specify one of these options | Yes |
|–db | The name of the database where everything is stored. The default is ‘daq’. | No |
|–logdir | The directory where you want logfiles to be written. Multi-host management is much simpler if all logfiles are written to the same network-mounted folder, because then you don’t need to log into 4 machines to see what they were all doing. Default is the working directory. | No |
|–log-retention | How many days to keep logfiles. Default is 7. | No |
|–arm-delay | How many milliseconds to wait between when you receive an ARM command and when you start processing it. Used to synchronize hosts across unusually slow databases. Default 15000. | No |
|–help | Print the command-line usage | |
Assuming we have a database at database.com port 27017 with user daq, password alsodaq, and authentication database authdb then the process on host daq0 might be started with:
./redax --id 0 --uri mongodb://daq:alsodaq@database.com:27017/authdb --reader --logdir /nfs/redax_logs
This will start a process that will be named daq0_reader_0.
The process naming convention is {HOSTNAME}_{PROCESS_TYPE}_{ID}, where PROCESS_TYPE is either reader or controller, HOSTNAME is the hostname of the PC, and ID is the number provided by the operator on the command line.
Also, the logfiles will be written to a central location.
For host daq1 we want to start two processes like so:
./main --id 0 --uri mongodb://daq:alsodaq@database.com:27017/authdb --reader --logdir /nfs/redax_logs
./main --id 1 --uri mongodb://daq:alsodaq@database.com:27017/authdb --reader --logdir /nfs/redax_logs
This will start processes with names daq1_reader_0 and daq1_reader_1. Note that these names are important for configuring the options documents in the next chapter!
Once the processes are started they will immediately begin polling the database looking for commands and updating the database with their status.
Crate Controller, Run on daq0
The crate controller module is responsible for the V2718 crate controller. It will also be responsible for configuring the V1495 general purpose module (if required) and the DDC-10 high energy veto module (if required).
Running it is the same as running the reader:
./redax --id 0 --uri mongodb://daq:alsodaq@database.com:27017/authdb --cc --logdir /nfs/redax_logs
Assuming you run that command on daq0 you’ll have a crate controller process running called daq0_controller_0. Identically to the reader process this program will immediately begin polling and updating the DAQ database.
Dispatcher Process
The dispatcher is a lightweight process and can run anywhere without fear of high resource use. It is also a vital process, so be sure to run it somewhere it can’t be ‘cut off’ from the rest of the system (i.e. within the subnet, one one of the readout PCs probably).
The dispatcher is started with:
cd redax/dispatcher
python dispatcher.py --config=options.ini
The file options.ini provides options for connectivity to the DAQ and runs databases as well as configuration options for various parameters such as timeouts. See the inline comments for more details on these options, though the defaults are likely fine except for the database URIs.
The dispatcher will immediately start monitoring the state documents (if there are any) in the daq_control collection of the daq database. It will also update the aggregate_status collection (again, only if any detectors were defined) by polling the status collection.
Optional Process: System Monitor
If using nodiaq there is funtionality to display key system parameters like CPU, memory, and disk usage of each host. An exceedingly simple system monitor is included, which dumps diagnostic data into a capped (or TTL) collection for display.
This is simply run with:
cd redax/monitor
python monitor.py
Ideally you would make this into a system service so you can always keep an eye on the health of your readout machines.